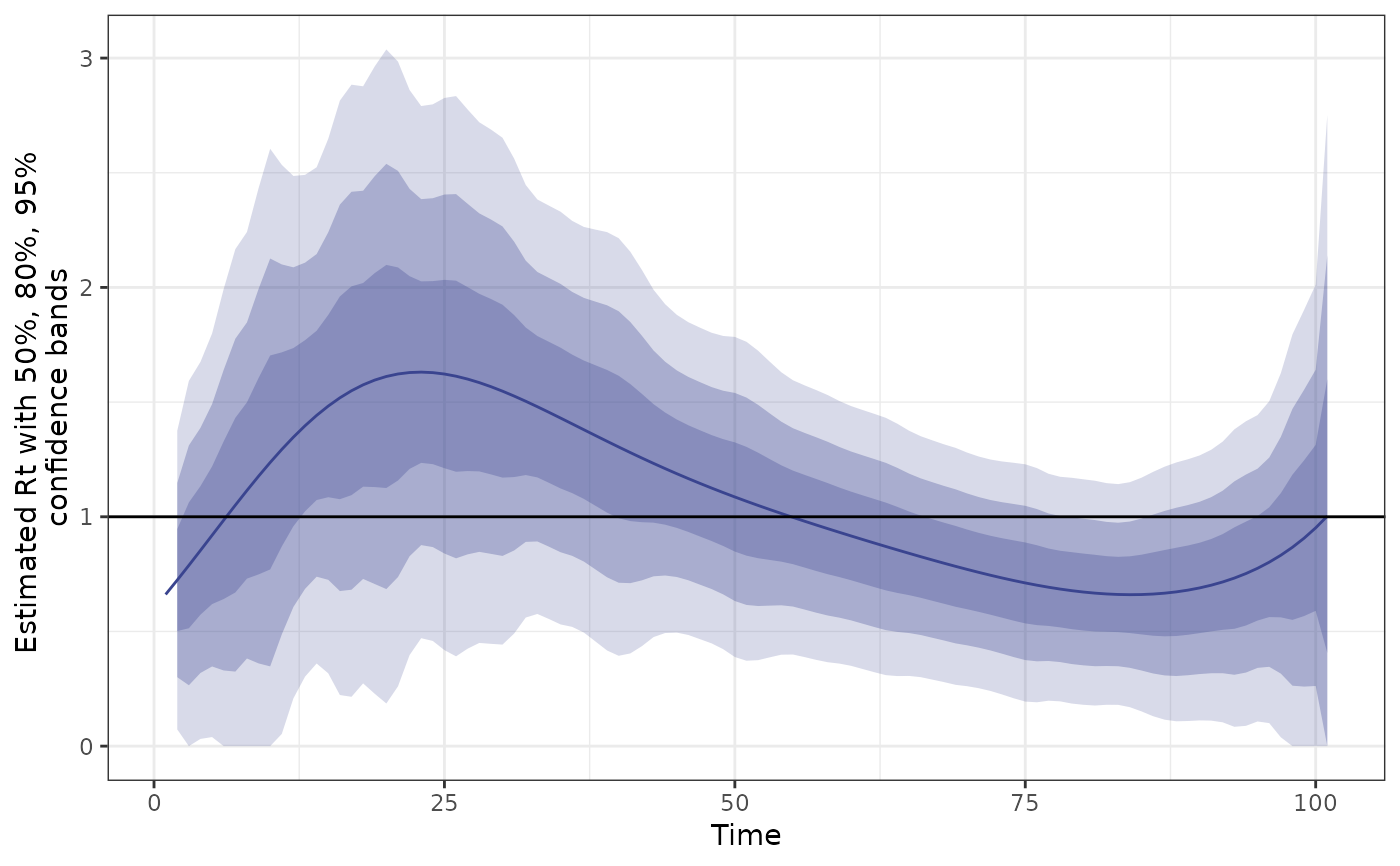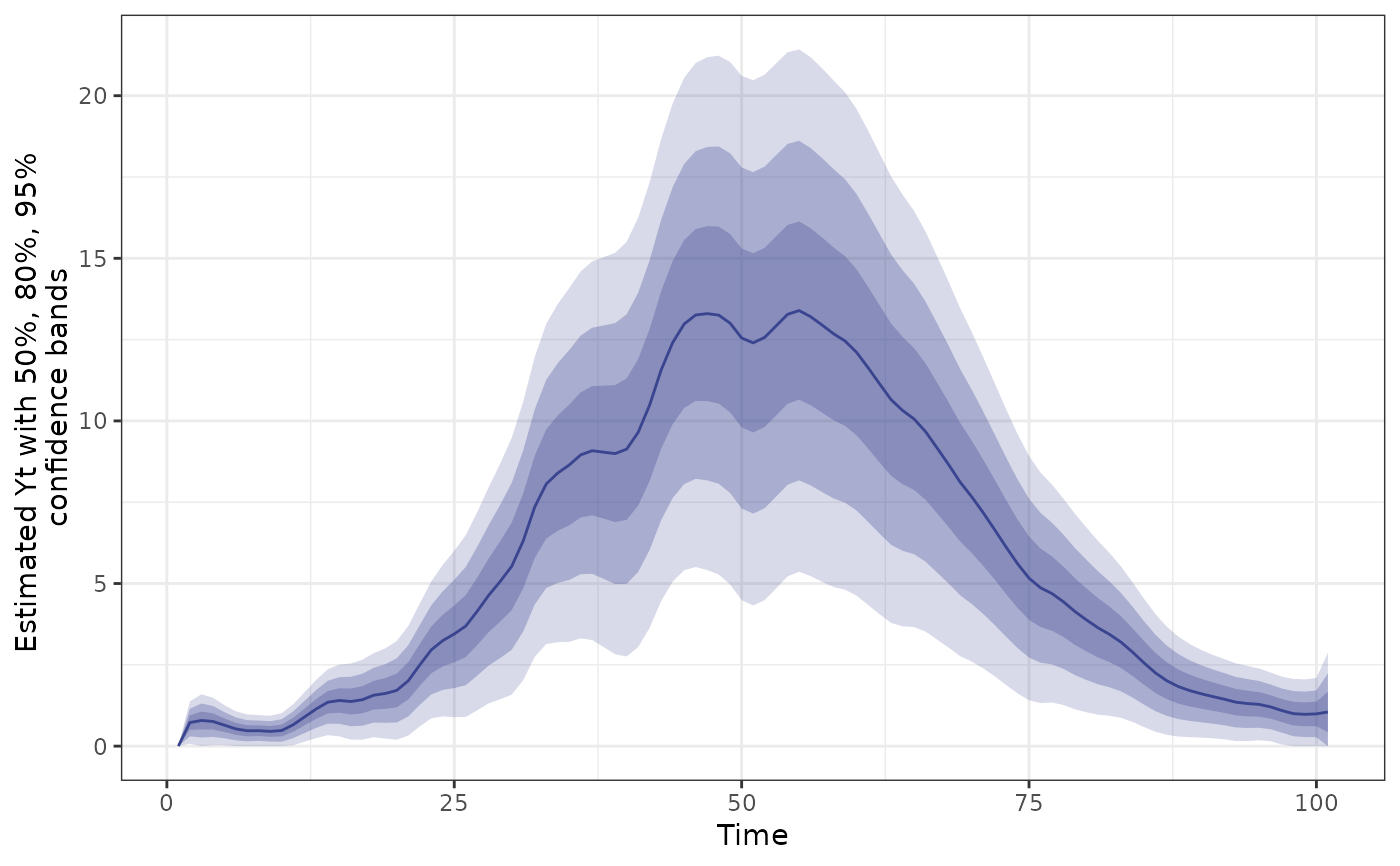
Plot estimated confidence bands for an estimate of Rt
Source:R/confband.R
plot.rt_confidence_band.RdProduces a figure showing a single estimated Rt value along with approximate
confidence bands. The result is a ggplot2::ggplot(). Additional user
modifications can be added as desired.
Usage
# S3 method for class 'rt_confidence_band'
plot(x, colour = "#3A448F", ...)
Arguments
- x
An object of class
rt_confidence_bandas produced byconfband().- colour
The colour of the desired plot
- ...
Not used.

