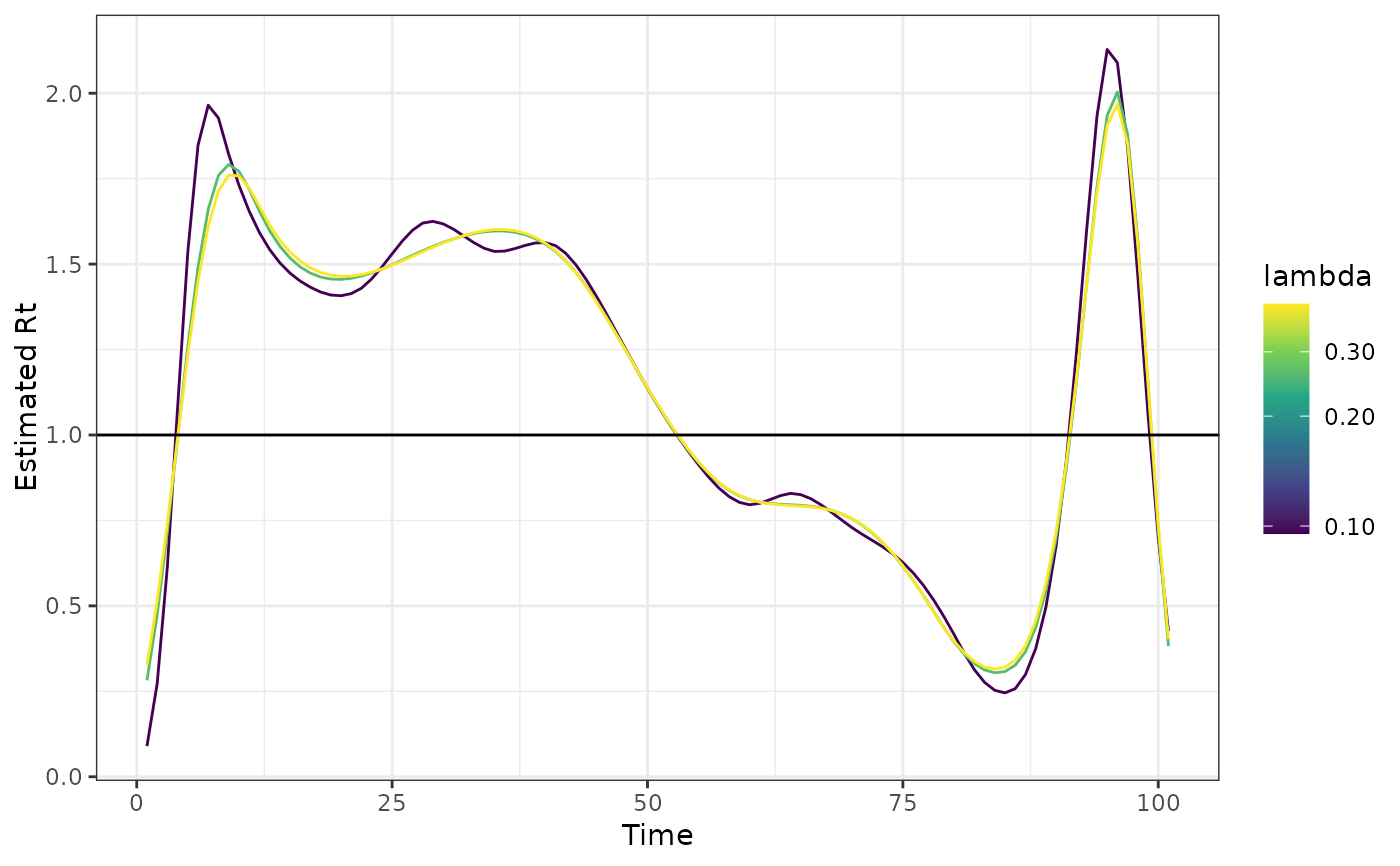
Produces a figure showing some or all estimated Rt values for different
values of the penalty. The result is a ggplot2::ggplot(). Additional user
modifications can be added as desired.
Usage
# S3 method for class 'poisson_rt'
plot(x, lambda = NULL, ...)
Arguments
- x
output of the function
estimate_rt()of classpoisson_rt- lambda
select which Rt's to plot. If not provided, all Rt's are plotted.
- ...
Not used.