Plot cross-validation curves produced from a cv.sparsegl object.
Source: R/plot.cv.sparsegl.R
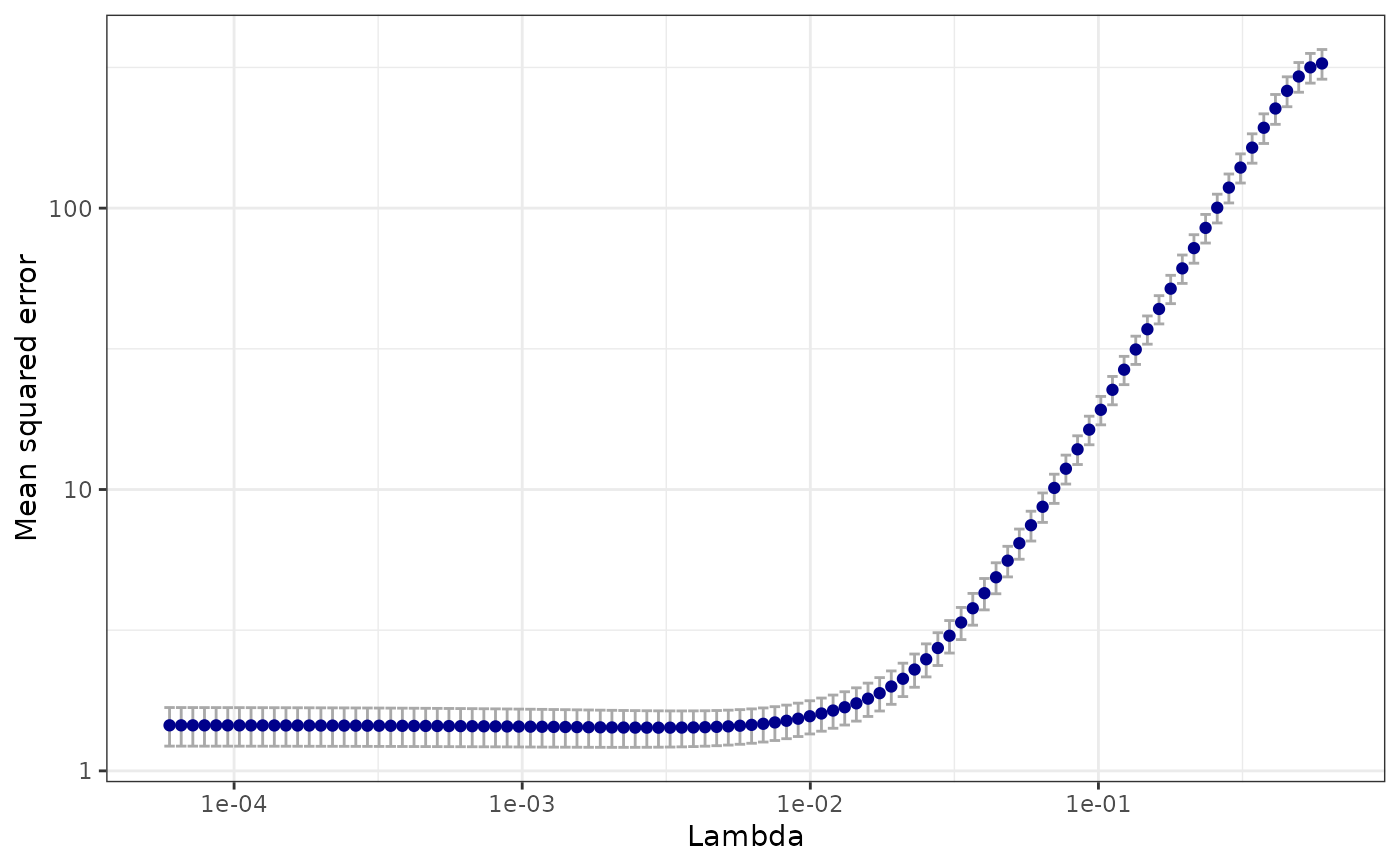
plot.cv.sparsegl.RdPlots the average cross-validation error and upper and lower 1 standard error bars. Dashed lines indicate the lambda that optimizes the CV error and the 1 standard error lambda.
Arguments
- x
Fitted
"cv.sparsegl"object, produced withcv.sparsegl().- log_axis
Apply log scaling to the requested axes.
- sign.lambda
Either plot against
log(lambda)(default) or the reverse ifsign.lambda < 0.- ...
Not used.
Details
A ggplot2::ggplot() plot is produced. Additional user
modifications may be added as desired.